At the end of the day, my overall goal is that every student will have an understanding and experience with a defined protocol in their individual lab notebooks that can serve as their reference when they go home and collect their data. I could be really helpful and just give them a well-structured set of laboratory instructions which would assure that most of the students who follow directions closely will succeed in getting the expected results thereby ensuring that my lab worked. Of course, I’d have to hope that they would somehow, subconsciously pick up on the kind of thought that had to go into the organization of the tables, the presentation of the graphs, the preparation of the materials, etc. My students never seemed to pick up that kind of thing, though by just following instructions. That insight seems to come with wrestling with the challenges. And since their thinking skills are more of a priority to me, I quit providing lab instructions very early in my career. It is a lot more messy and you’ll be amazed at how many ways a student can go down the wrong path but I found that trusting the students to figure things out, works–they get better and better at it which makes the class more fun for me and for them. For me, this lab fell pretty early in the year and for that reason it was a bit messier than it might have been had we worked on it later in the year. It is important to note that I don’t just “turn the students loose” to go design whatever they can conjure up. That is a recipe for disaster in so many ways but most importantly it typically leads to all sorts of negative student experiences. The goal is to keep the challenges in front of the students finally tuned to their developing skills–to keep the students, as best we can, in the “zone”or perhaps better defined as: Mihály Csíkszentmihályi’s FLOW.
Some of my learning goal targets that I keep in mind to guide my questions during discussing include: 1. Introducing the floating disk technique but making sure the students understand how it is working. 2. How do we explore variables systematically. (serial dilutions) 3 What is this replicability thing?, 4. Emphasizing the importance of exploratory work to help establish data that can inform design. 5. How big of sample do we need? What factors into determining sample size? 6. Identify and contrast systematic and random error.
With these thoughts guiding my questions we launch into a discussion about the mess I created earlier.
With practice over the years it is easy to have barrage of questions ready to go. Typically, I reframe/choose my next question based on student responses. In that way, we are all following along on the same reasoning path–or at least as much as 20+ individual agents can follow the same path.
What did we mix to create the mess? What did we get out? How is this related to the models we explored? How could we quantify what is going on? What are we going to try and figure out? What can we control? What do we need to know? What should we measure? How should we systematically measure it? How can we be sure to all generate data/information that can inform our exploration? How can I capture the products produced? How do I measure the products over time? What could/should I use for controls? What should we quantify if we want to make a claim? This last question can be particularly productive if out goal is to collaboratively develop an experimental protocol. I never know exactly where we will go but with the guiding questions in my mind and with practice on my part it doesn’t usually take too long before we get to a starting/exploratory protocol that we can test in class.

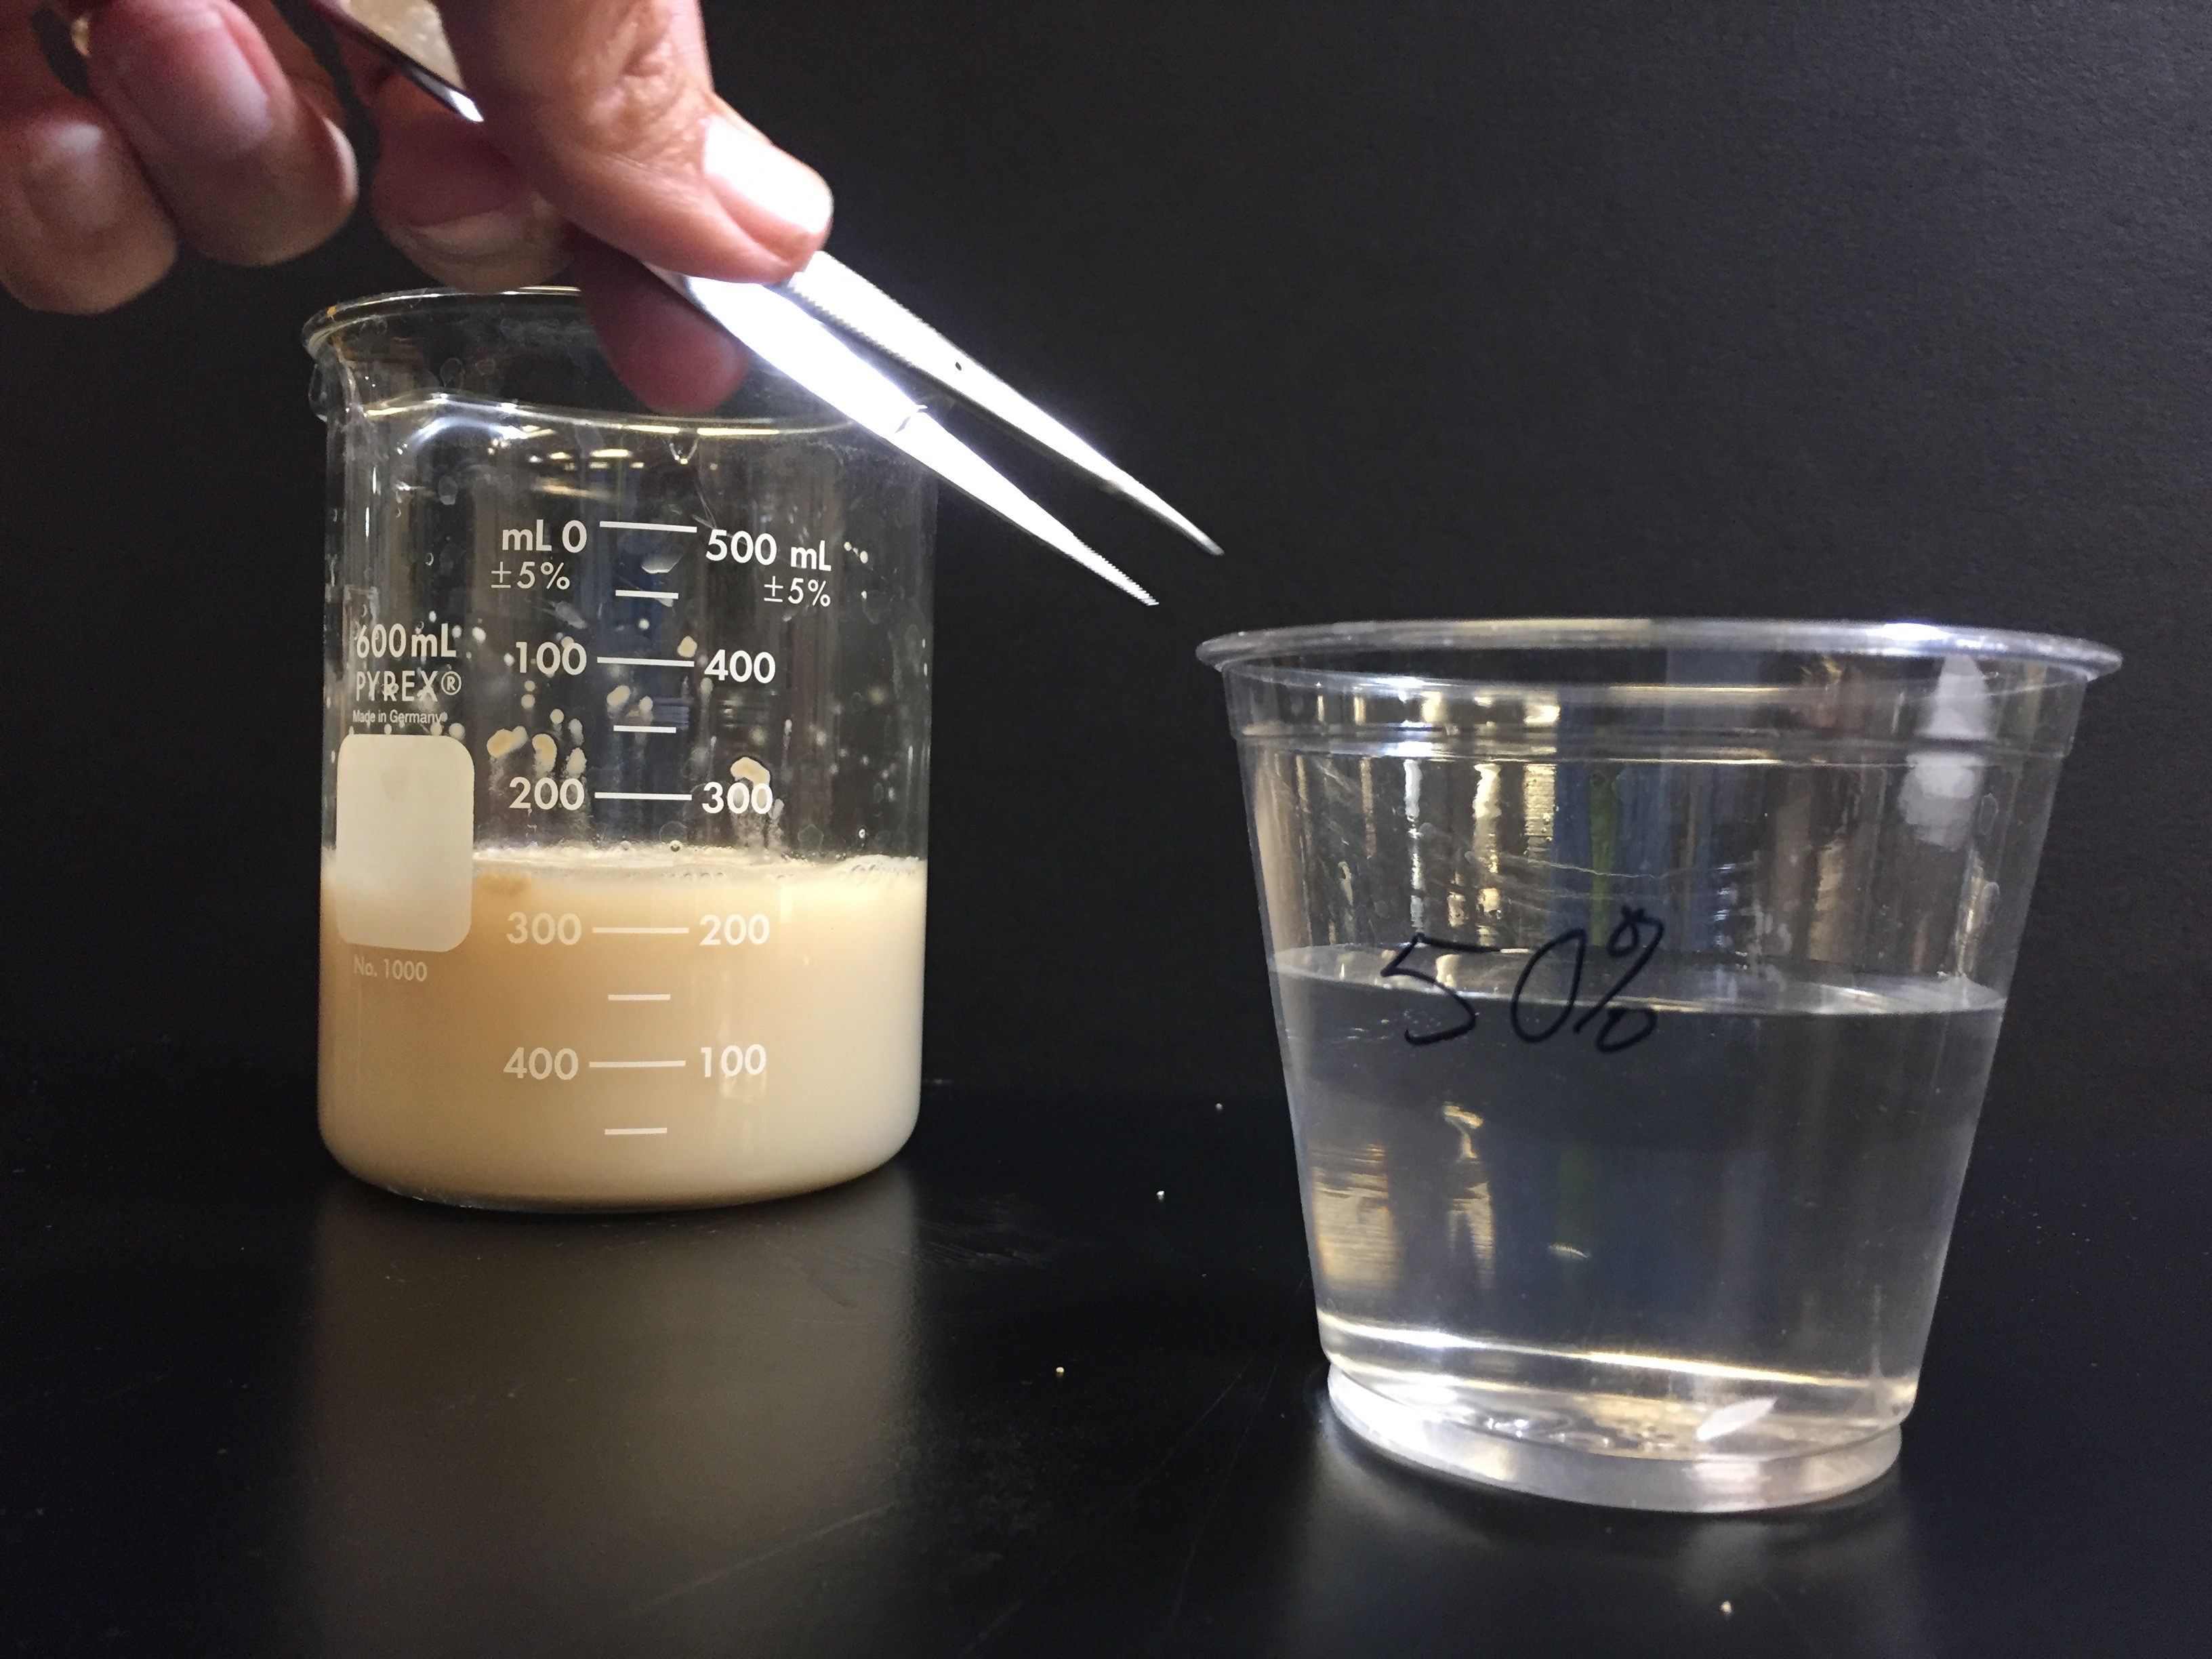
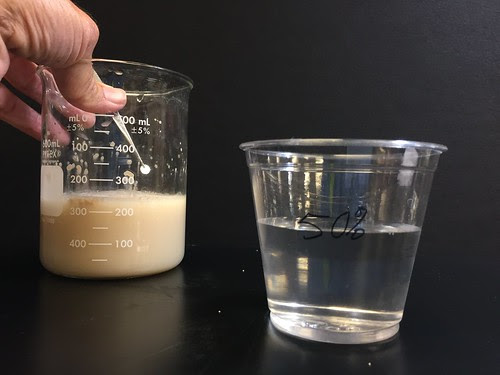
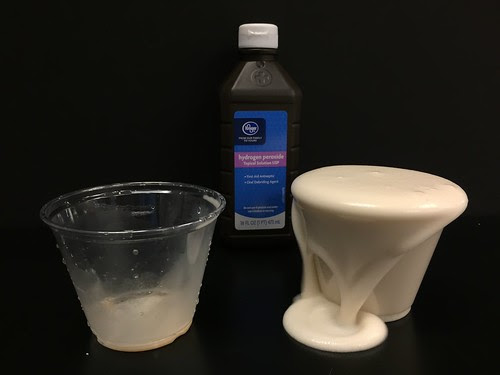
At some key point in the discussion (you’ll know when) I demonstrate the floating disk technique itself along with some qualifying statements/comments like: “Let’s reduce the amount of yeast/catalase but try and keep it constant. One way might be to collect a sample on a piece of filter paper like this.” You can guess the next line: “Now let’s see if this will generate some bubbles that we can count or observe.” At that point when we drop the disk in the H2O2 it sparks questions in their my minds when the disk floats. Of course this prompts me to ask more questions. These questions are now more specific to developing the protocol: What do you think would happen if we dropped the yeast disk into plain water? (control) What would happen if we dropped a paper disk without yeast into H2O2 ? (control) If I dropped another disk into the H2O2 will it take the same amount of time to rise? If not, how could I capture the variation? Why is the disk rising? How many disks can I drop in the H2O2 before it affects the time to rise? (why I used the well plate and a single disk). At this point I may take time to have them time a number of disks dropped into the same substrate dilution to get some preliminary data to work with.
If I keep the yeast concentration constant how can I systematically vary the H2O2 solution? This was my main objective in the past because I used the lab to introduce serial dilutions and how to make them–skills that came in handy later when we did our microbiology labs. At this point we could work through a serial dilution without a formal measurement device. Since, my goal was to do most of the lab work at home, we adapted by doing our dilutions with a “measure”–which was a sharpie mark a little less than half-way up one of the plastic cups. 1 measure of water and 1 measure of 3% H2O2 would equal a 1.5% solution of H2O2 and a 50% dilution. That solution could then serve to produce the 25% dilution and so on. If this isn’t clear, let me know and I can put up a small video of the process if that will help.
And a question that I would ask today but didn’t in the past: Is the time to rise the same as the rate of rise? How can I convert time to a rate? Today, I’d consider this one of my primary objectives for this lab. Like I said earlier my primary goals in the past were to get the students comfortable with serial dilutions, experimental design and data presentation. But from a standpoint of content and lab integration, I think I’d focus more on the properties of enzymes now. Explicitly exploring rate of reaction is a key quantitative question to work on because it challenges a common quantitative misconception (confusing rates and quantities) and it also creates a situation where we can address the data in a form that is similar to standard laboratory work with enzyme kinetics.
Other questions come from students as we work on a protocol—questions about how to drop the disk, how do I keep the yeast constant? do I have to stir? when to time the float?, how deep should the solution be?
And: How many disks should I drop to be confident that I have measured the rate of rise? In the past, I had my students collect data on 10 disks of yeast per substrate concentration because I used this lab to introduce box plots. The choice was somewhat arbitrary but you need a sample of 10 or more if the box plot is going to provide relevant information. For example, a sample size of 4, split into 4 quartiles isn’t going to tell me much. In today’s AP Bio world I might use this lab as an opportunity to explore another way to estimate an appropriate sample size–using standard error. Here’s how that works.
Pre-Determining Sample Size:
I’m pretty upset with myself that I didn’t teach this in the first half of my career for many reasons but the most important is that I think students need to make that link that helps them to realize that quantitative methods provide strong support for their claims. One question I never got around to helping my high schoolers figure out was how to justify their sample size. I kind of let it slide with general statements like: “Well, three is not enough.” “Let’s do at least 10.” and so on. Here’s how the discussion would go today.
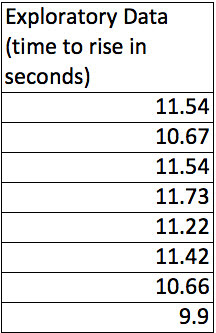
First, during the exploratory work we’d collect some data from an “unknown” substrate solution and an unknown yeast solution. Here’s the data.
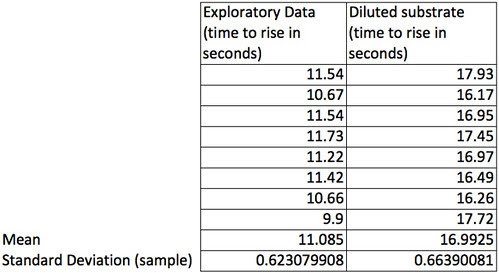
Looks pretty consistent but there is almost 2 seconds difference in the time to rise between the slowest and the fastest disk. Let’s see what happens if we dilute the substrate by 50% but keep the yeast concentration on the disks the same.
Now, that is interesting. The time to rise in the diluted substrate definitely seems to take longer. Just eye-balling it it looks like a difference of about 6 seconds–more than 50% longer. Still there seems to be about 2 seconds of variability in the diluted substrate results as well. How can we capture all this in a couple of numbers?
Descriptive stats to the rescue.
The means can help us by using a single number to represent all of the data collected under one condition and the standard deviation (of the sample) can help us describe the amount of variation in the sample.
For many, this would be enough to consider. The differences between these two samples of 8 is more than a standard deviation–in fact more than 3 standard deviations. They are really quite different results. A sample size of 8 seems to an easy sample to collect but what if we wanted to collect smaller samples because our fingers cramp up working the stop watch so many times? Could we use a smaller sample size and still collect data that will support our claims that these are different? Let’s see how we might determine that.
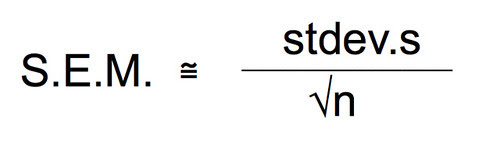
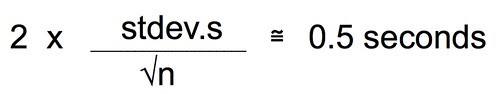
First let’s agree on a level of precision that we think we will need. To do that let’s take a look at the differences in the means. The difference is almost 6 seconds. Now, each time I do this experiment under the same conditions I will likely get slightly different means. How confident am I that my sample mean is close to the actual population mean? Means are a point estimate but I want to put an interval estimate around that point. Let’s say that if I can establish an interval of the mean plus or minus 0.5 seconds then I’ll feel pretty confident that my experiment has captured the true population. How about 95% confident? To be about 95% confident in our point estimate of the mean in seconds with an interval estimate of plus or minus 0.5 seconds we need to work with the standard error of the mean (SEM). Bear with me while I do the algebra and violate my principle of being less helpful. 😉
Remember that the formula for SEM is:
I’ve used the approximately equal to because we can only estimate with the standard deviation of the sample. The actual SEM would require the true population standard deviation. Our exploratory data has provided us with an estimate of the standard deviation. With this equation we can solve for n to try and figure a different size of a sample size—a smaller one that could still provide us with confidence.
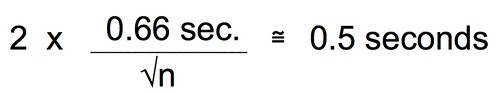
You may also remember that 2 x SEM is approximately equal to a 95% CI.

Let’s combine these two equations and since, earlier we decided that plus or minus 0.5 seconds was probably enough precision we can just substitute that for the 95% CI.
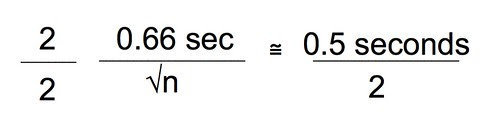
Substitue 0.66 for the stdev.s that is estimated from our exploratory data:
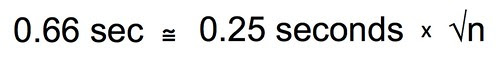
Divide both sides by 2.
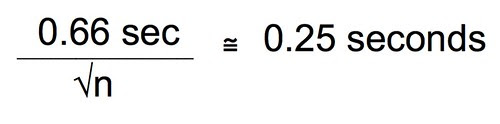
Multiply both sides by the square root of n.
Divide both sides by 0.25 seconds.
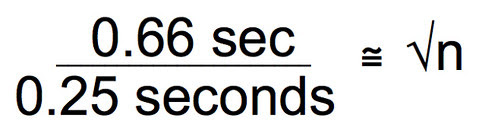
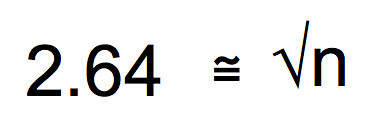
We are getting close, now. Square both sides and you end up with the sample size you’ll need to assure that you have a 95% confidence interval that is plus or minus 0.5 seconds around the mean of your sample.
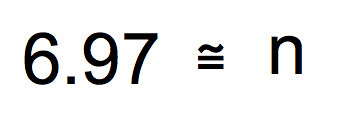
Ah, finally. Looks like a sample size of 7 will assure that the 95% CI will fit between plus or minus 0.5 seconds around the mean. Of course if we wanted a 99% CI we could use 3 x SEM in the work. Or we could define a more precise CI interval of say 0.25 seconds around the mean. It is up to you. But with this type of work, you can make a strong argument as to why you chose the sample size you chose.
***************************************************************
Their lab notebooks, at this point will have drawings and instructions in their own words on how to do a serial dilution, sample data, procedures, and background information (and perhaps some model data). I’ll send them home with my question to work first with the intent of them repeating the homework at home on a different question, later the next week after they have worked to develop their skills. The question I ask them to investigate is: How is the rate of the enzyme reaction affected by the concentration of the substrate? They can work in groups, with their family, or by themselves but I want everyone to have a lab notebook entry of the methods, the questions, the design and the data they have collected along with graphs of the data. I’m not explicit about what that should look like at this point. I don’t want to be too helpful. I actually want mistakes so we can address them. If I’m too helpful at this point and tell them to make a scatterplot of just the means of the time to rise versus the substrate concentration then many will be will not know how to work in a novel situation in the future.
The mistakes that will no doubt appear provide an important starting point for the discussion on analysis. That will have to wait for the next installment….