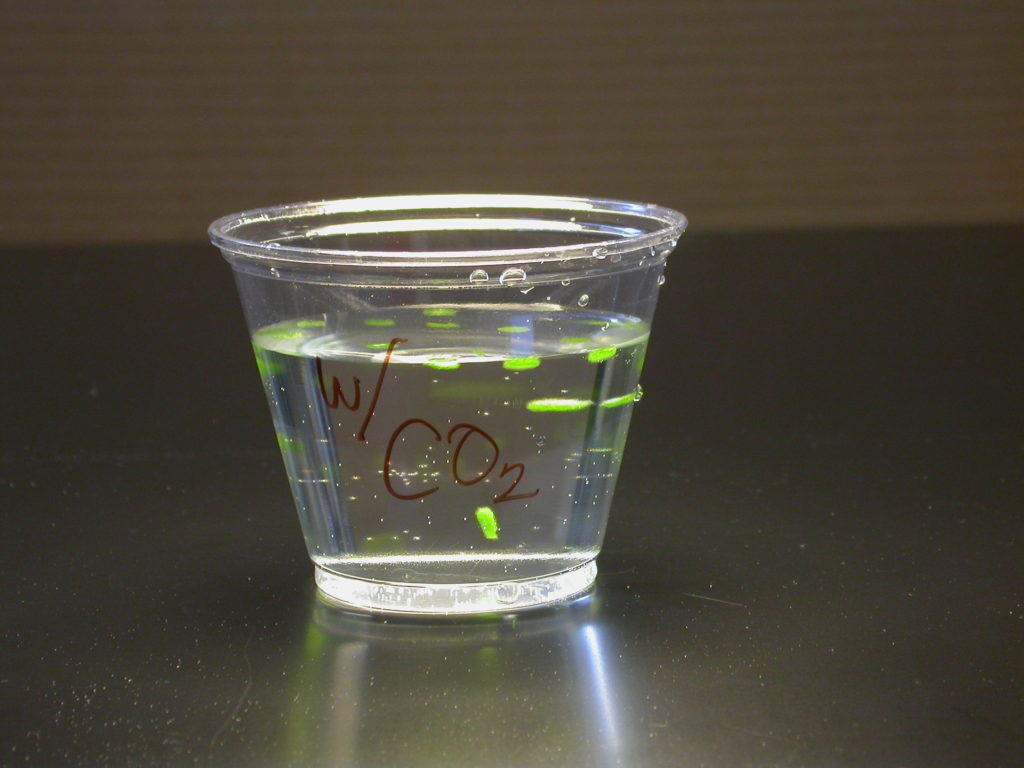
When I was teaching, I’d introduce a promising technique to students with a structured lab investigation. Doing so allowed my students to acquire the skills needed so that they could explore their own questions later. In the case of the Floating Disk Assay for Photosynthesis, we compared rates of photosynthesis with a carbon source (sodium bicarbonate) and without. Each student was required to successfully navigate through the procedure and as they do, together as a class, we would generate questions that guide the students later on their own independent investigations.
For more than 25 years, I have promoted the floating leaf disk assay as one of the best ways for students to explore factors that affect photosynthesis. It’s replicable, it’s cheap, it’s accessible, and most of all it’s fun. About 20 years ago I created a web page for biology teachers to serve as a guide on the floating leaf disk assay or how to do the procedure. Its purpose to serve as my demonstration of the procedure to the biology teaching community. It’s up to you to decide what your questions are and how you’ll adapt the procedure to answer those questions.
Here’s a pdf of the old web page that you might want to use as a hand-out of the procedure.
http://www.bradwilliamson.net/wp-content/uploads/2019/10/Floating-Leaf-Disk-Brad-Williamson.pdf
Since then, the lab has become standard fare in a biology class and as a community, we’ve learned a lot. I thought it time to revisit the web page I made so long ago and bring it up to date. I’ve kept much of the original web page and added some additional ideas to the overall procedure on this page. I’ll cover details for teachers to consider while teaching and managing this lab in other posts on this topic
BW
The Floating Leaf Disk Assay for Investigating
Photosynthesis
(A resource page)
Brad Williamson
Introduction:
Trying to find a good, quantitative procedure that students can use for exploring photosynthesis is a challenge. The standard procedures such as counting oxygen bubbles generated by an elodea stem tend to not be “student” proof or reliable. This is a particular problem if your laboratory instruction emphasizes student-generated questions. Over the years, I have found the floating leaf disk assay technique to be reliable and understandable to students. Once the students are familiar with the technique they can readily design experiments to answer their own questions about photosynthesis.
The biology behind the procedure:
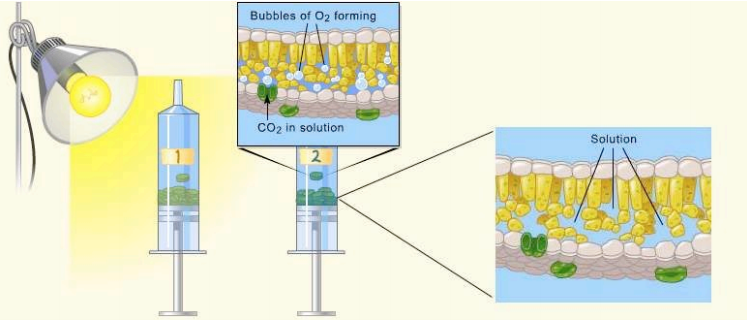
Leaf disks float, normally. When the air spaces are infiltrated with the solution the overall density of the leaf disk increases and the disk sinks. The infiltration solution includes a small amount of Sodium bicarbonate. Bicarbonate ion serves as the carbon source for photosynthesis. As photosynthesis proceeds oxygen is released into the interior of the leaf which changes the buoyancy–causing the disks to rise. Since cellular respiration is taking place at the same time, consuming oxygen, the rate that the disks rise is an indirect measurement of the net rate of photosynthesis.
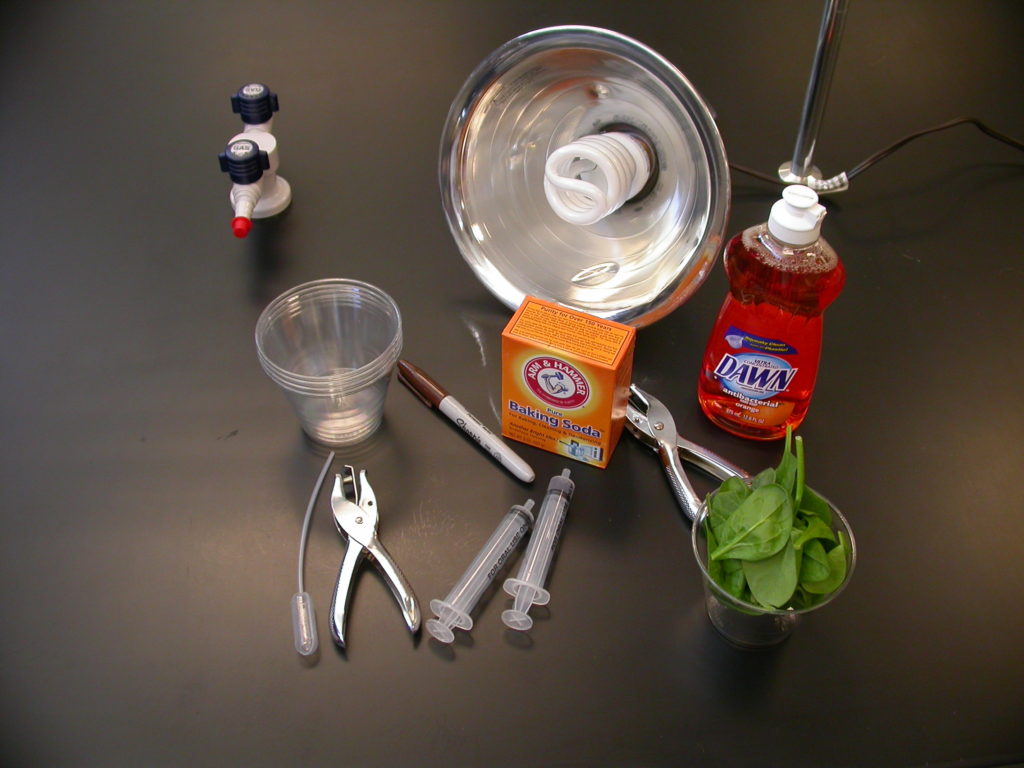
Materials:
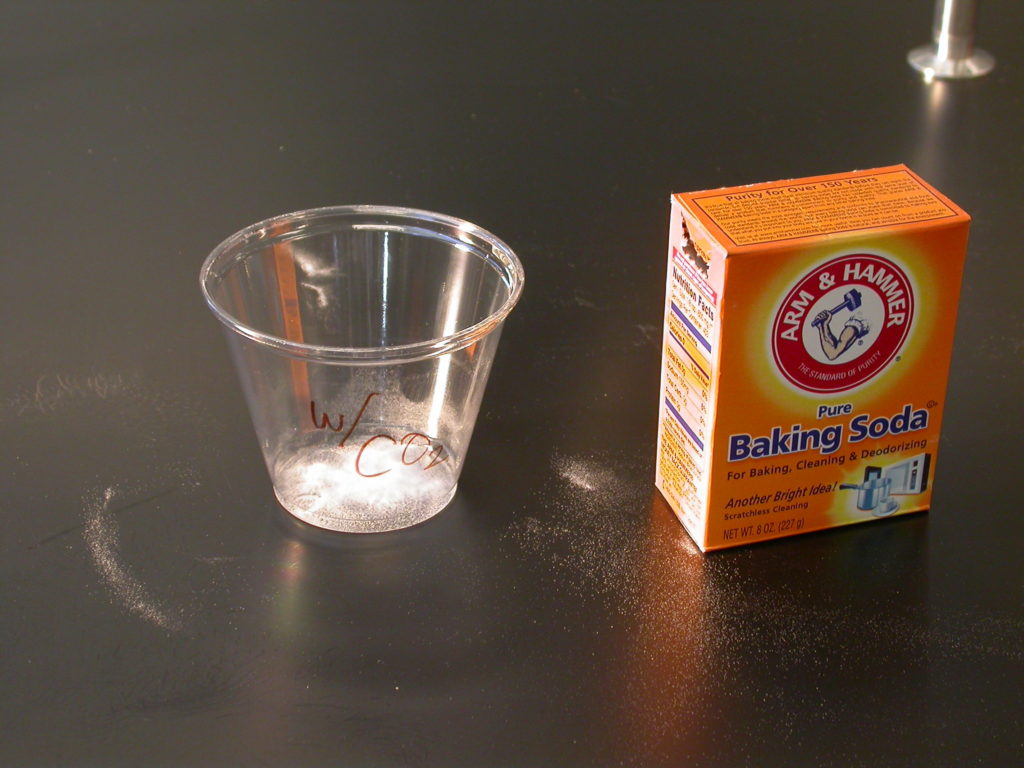
- Sodium bicarbonate (Baking soda)
- Liquid Soap
- Plastic syringe (10 cc or larger)—remove any needle!
- Leaf material
- Hole punch
- Plastic cups
- Timer
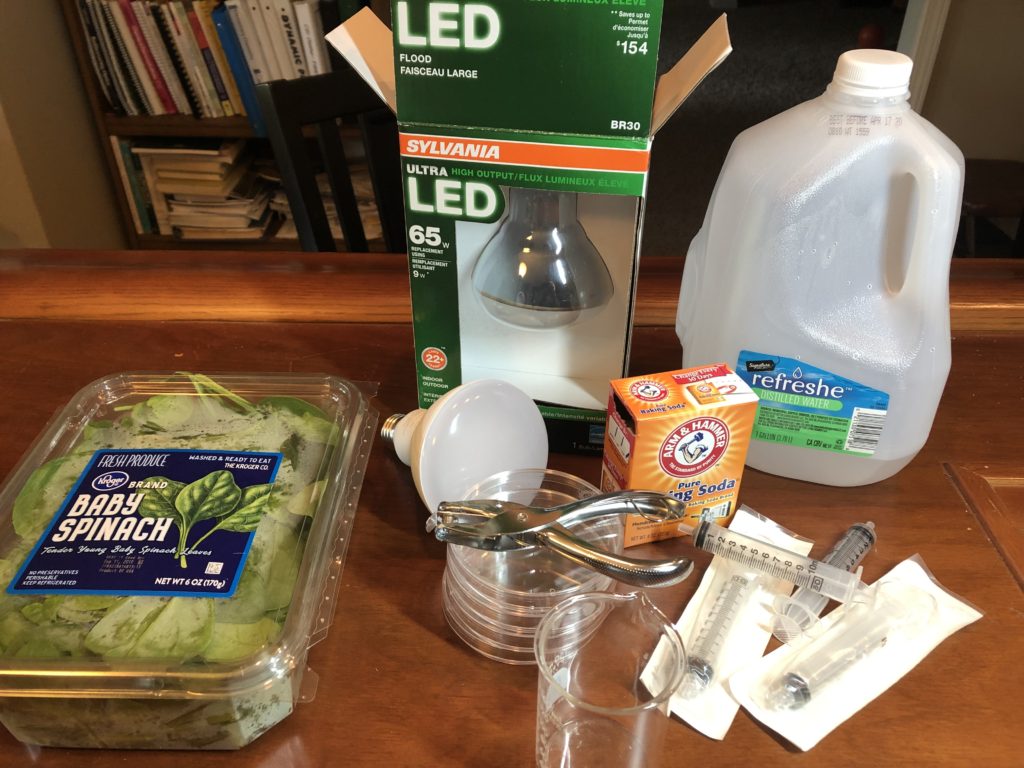
- Light source (old overhead projector, light banks, LED floodlights)
Consider using an LED light source.
Optional:
- Buffer Solutions
- Colored Cellophane or filters
- Leaf material of different ages
- Variegated leaf material
- Clear Nail polish (to look for stomata, optional)
Procedure:
- Prepare 300 ml of bicarbonate solution for each trial.
- The bicarbonate serves as an alternate dissolved source of carbon dioxide for photosynthesis. Prepare a 0.2% solution. (This is not very much, it is only about 1/8 of a teaspoon of baking soda in 300 ml of water.) Too much bicarb will create a solution where the procedure will not work.
- Add 1 drop of dilute liquid soap to this solution. The dilute soap solution can be prepared by mixing about 3 ml of Dawn dishwashing soap in 400 ml of water. Use only a drop or two of this solution in your infiltration solution and only if you need it. The soap wets the hydrophobic surface of the leaf allowing the solution to be drawn into the leaf. It’s difficult to quantify this since liquid soaps vary in concentration. Avoid suds. If your solution generates suds then dilute it with more bicarbonate solution.

- Cut 10 or more uniform leaf disks for each trial.
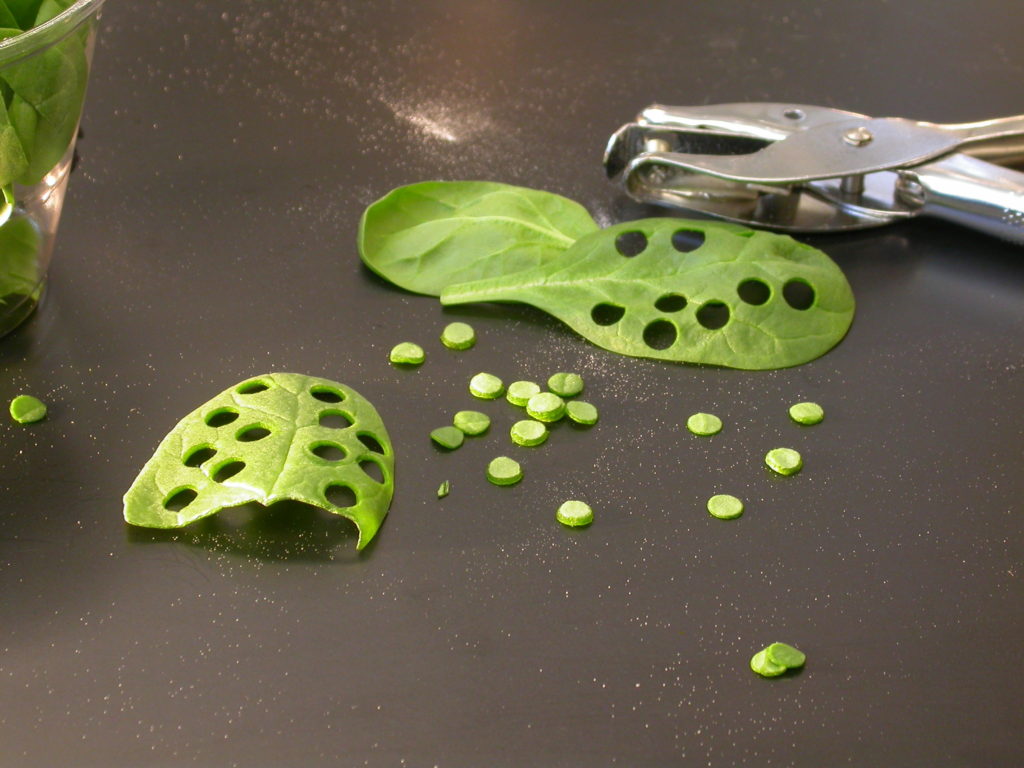
- Single hole punches work well for this but stout plastic straws will work as well.
- The choice of leaf material is perhaps the most critical aspect of this procedure. The leaf surface should be smooth and not too thick. Avoid plants with hairy leaves. Ivy, fresh spinach, Wisconsin Fast Plant cotyledons–all work well. Ivy seems to provide very consistent results. Many different types of plant leaves work for this lab. My classes have found that in the spring, Pokeweed may be the best choice.
- Avoid major veins.
- Infiltrate the leaf disks with the Sodium bicarbonate solution.
- Remove the piston or plunger and place the leaf disks into the syringe barrel. Replace the plunger being careful not to crush the leaf disks. Push on the plunger until only a small volume of air and leaf disk remain in the barrel (< 10%).
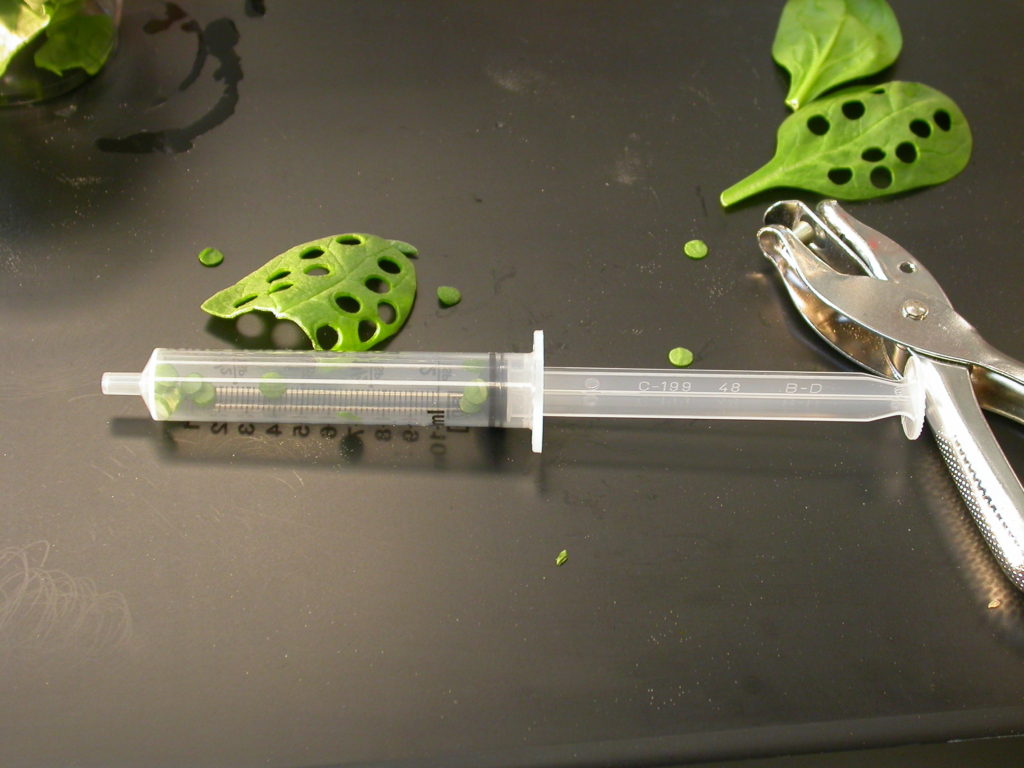
- Pull a small volume of Sodium bicarbonate solution into the syringe. Tap the syringe to suspend the leaf disks in the solution.
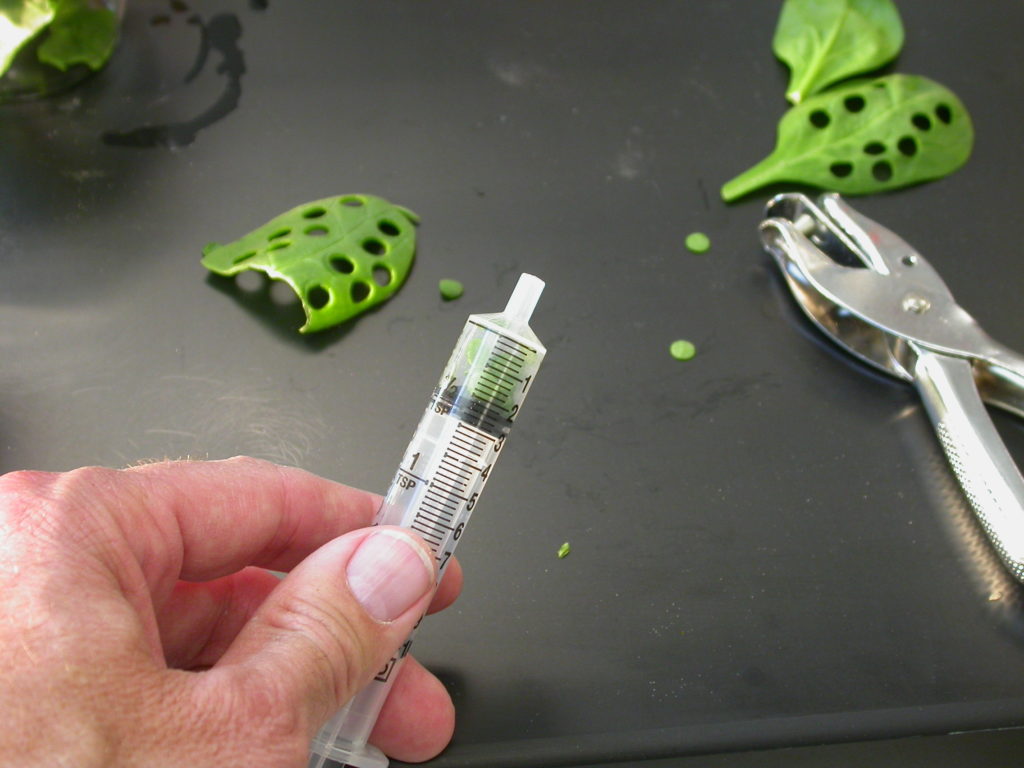
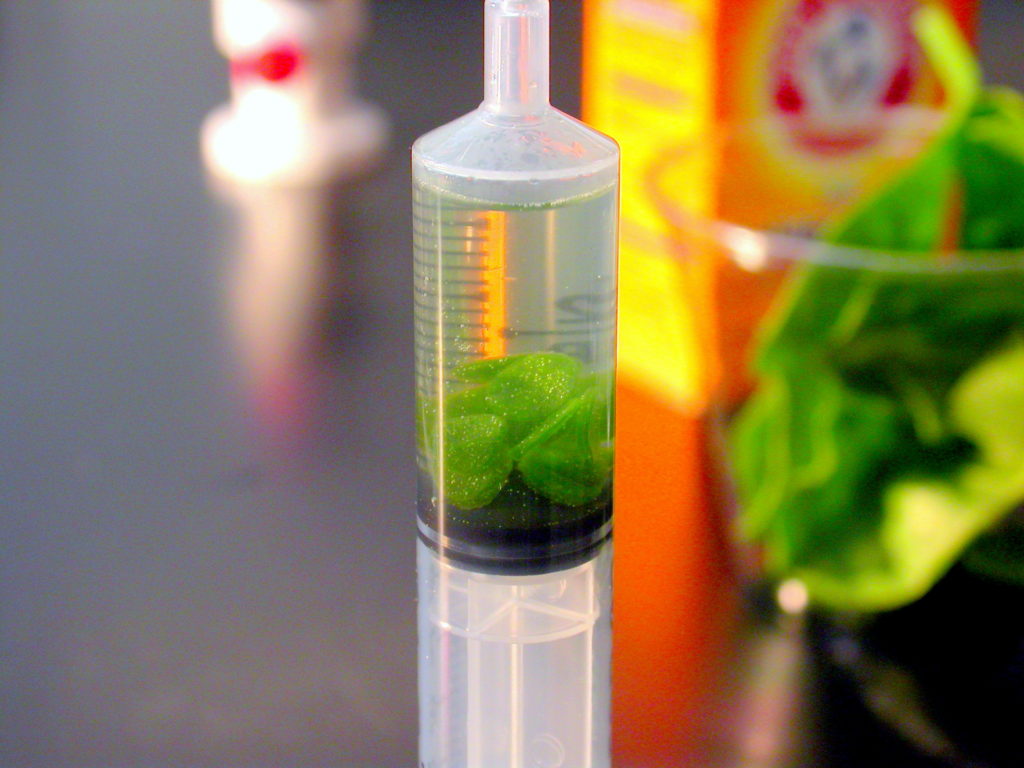
- Hold the syringe vertically and slowly push in the plunger until just a bit of the infiltration solution is forced out–which reduces the amount of air space above the floating disks. This is an important step.
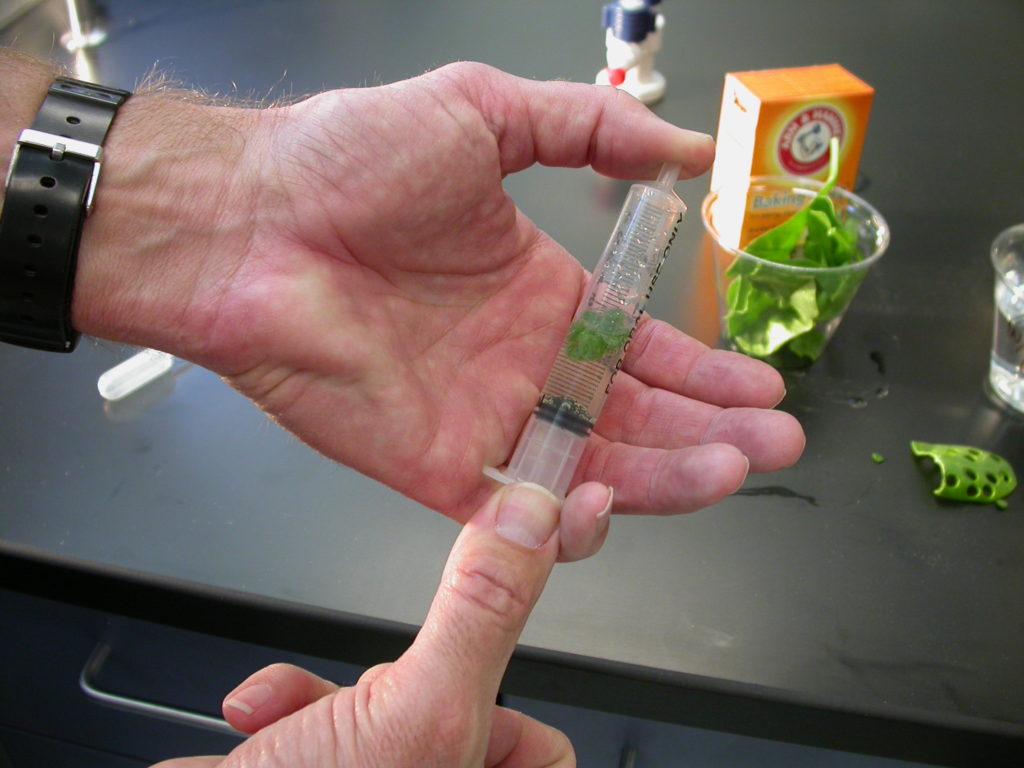
- Holding a finger over the syringe-opening, drawback on the plunger to create a vacuum. Hold this vacuum for about 10 seconds. While holding the vacuum, swirl the leaf disks to suspend them in the solution. Let off the vacuum. The bicarbonate solution will infiltrate the air spaces in the leaf causing the disks to sink. You may have to repeat this procedure 2-3 times in order to get the disks to sink. Don’t overdo the vacuum procedure. Too much vacuum can damage the cells and cell spaces in the interior of the leaf and the procedure will likely not work. If you see the infiltration solution turning green you likely overdid the vacuum procedure.
Here’s an old video I did to help out an AP Bio teacher whose students were having a hard time getting their disks to sink. Note that I forgot to add the soap solution but the ivy disks still sank easily. Also, note I’m not pushing on the plunger, I’m pulling on it.
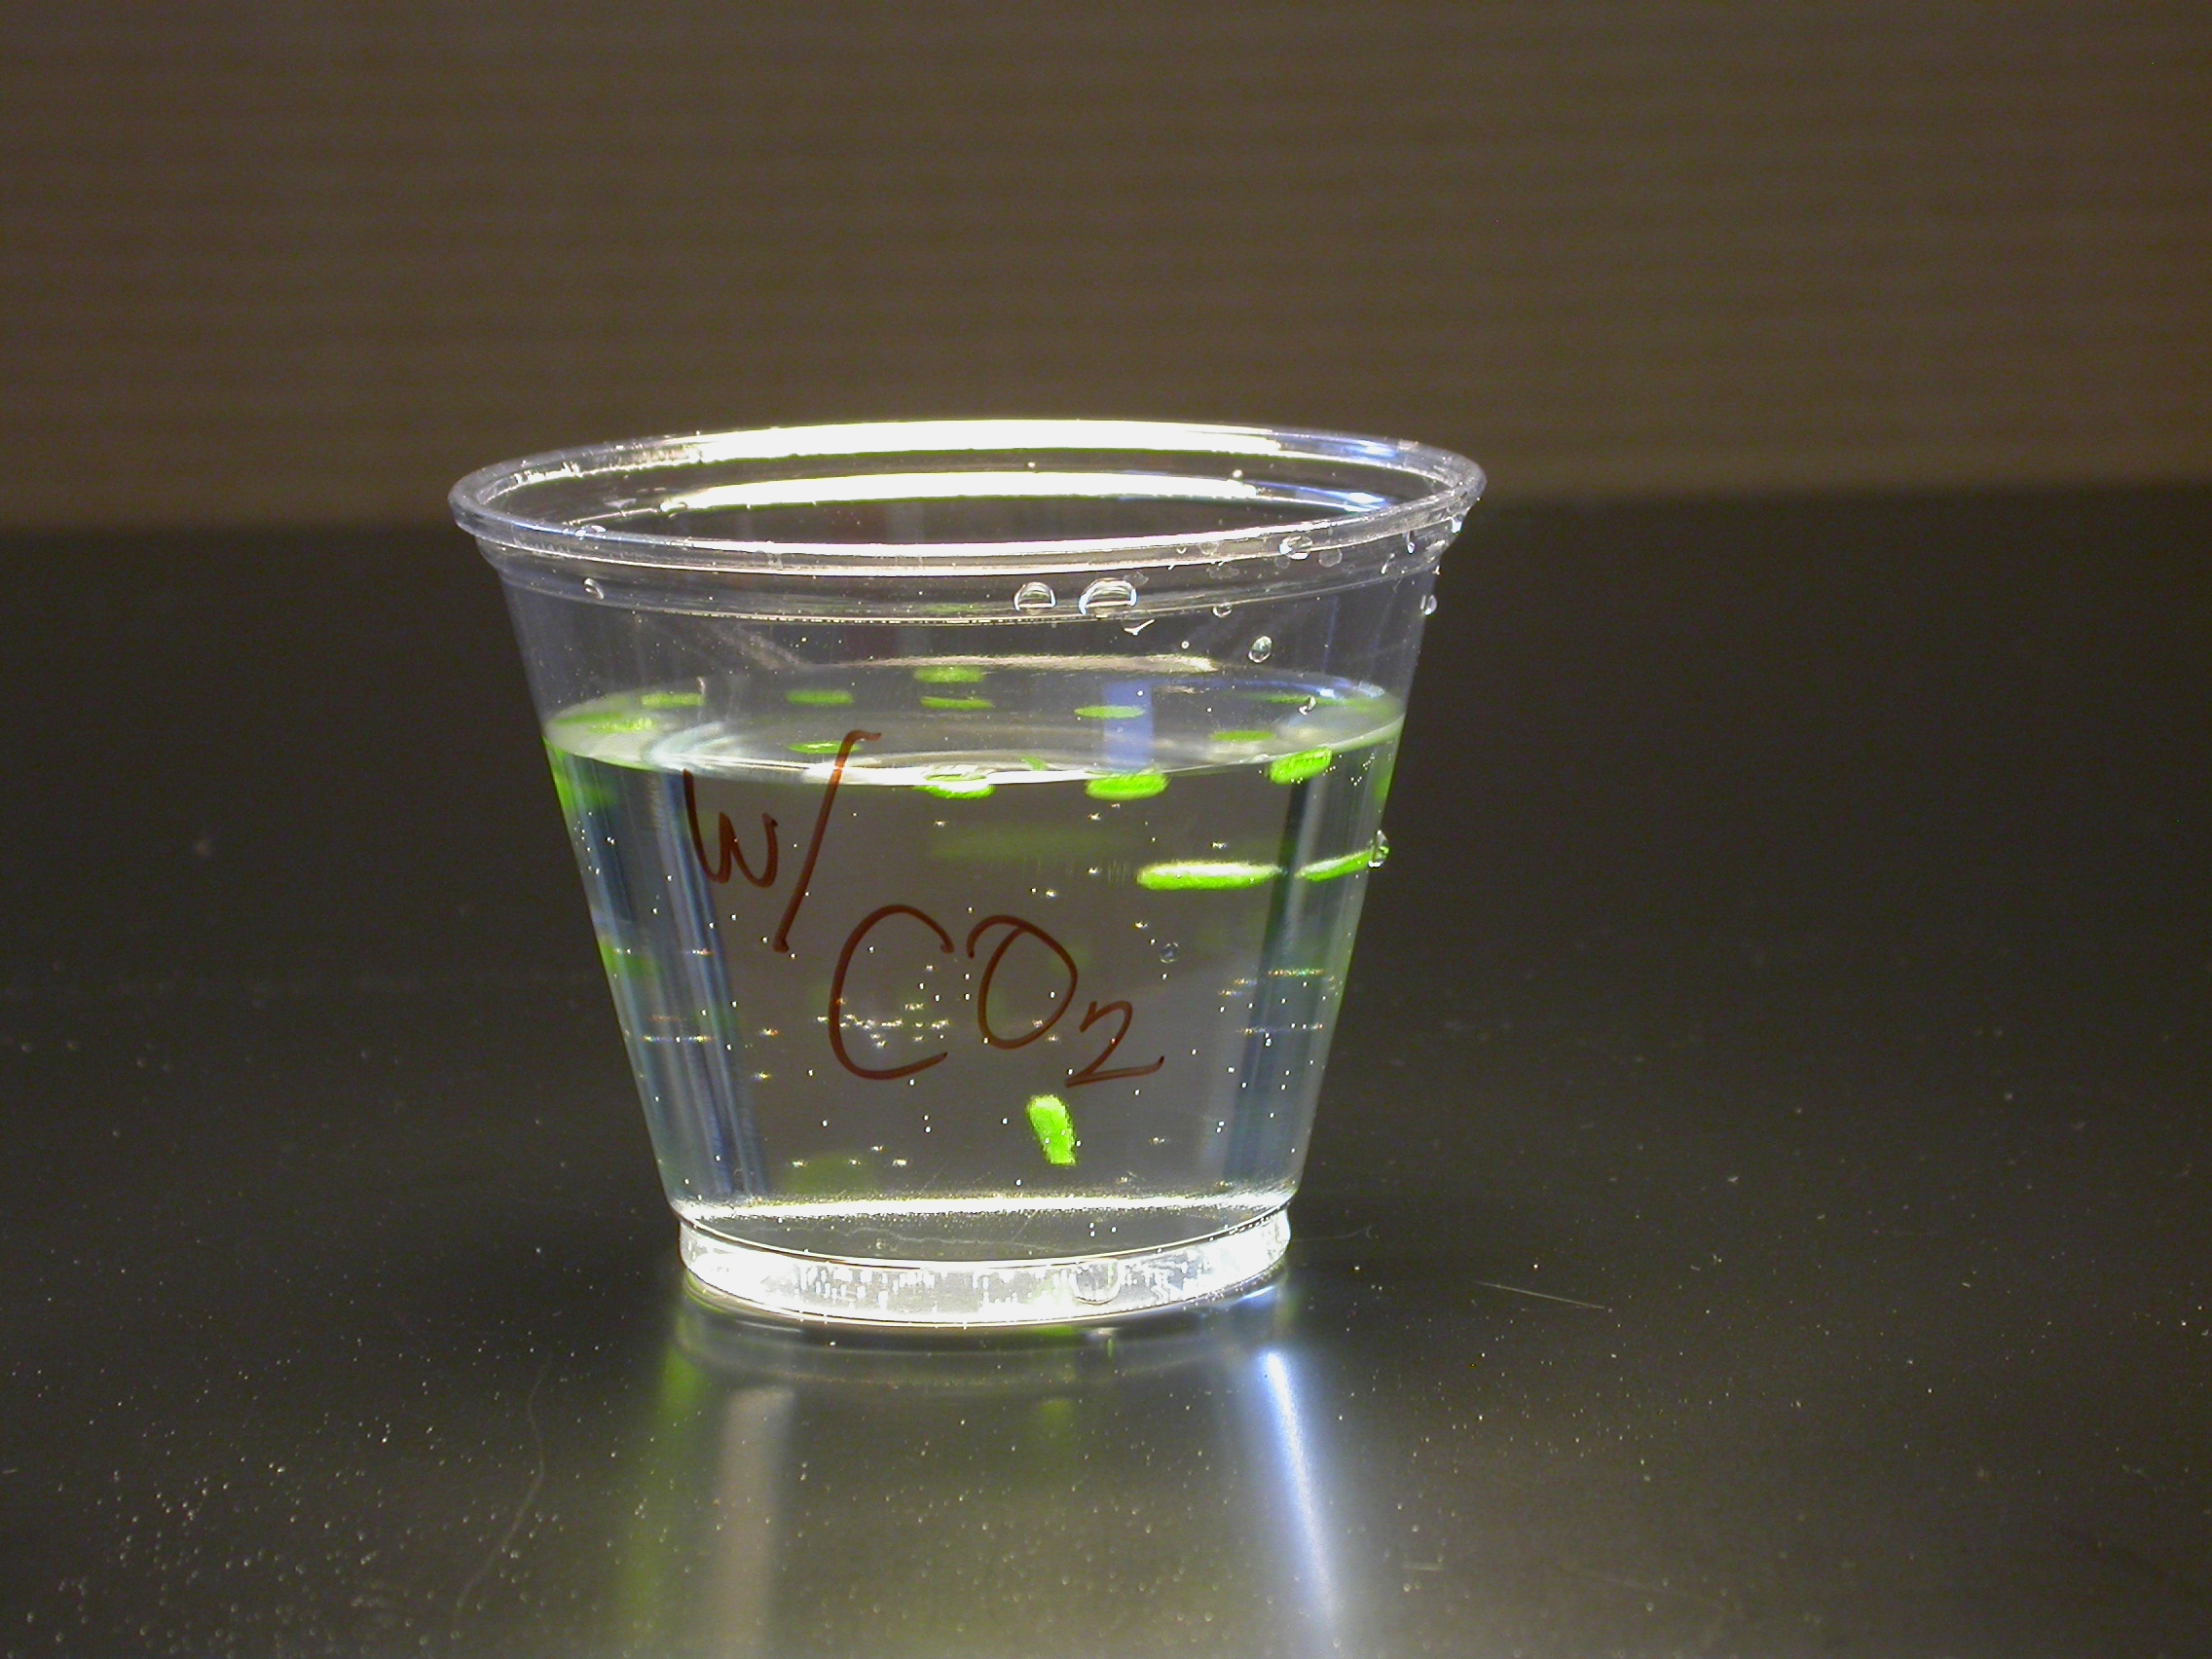
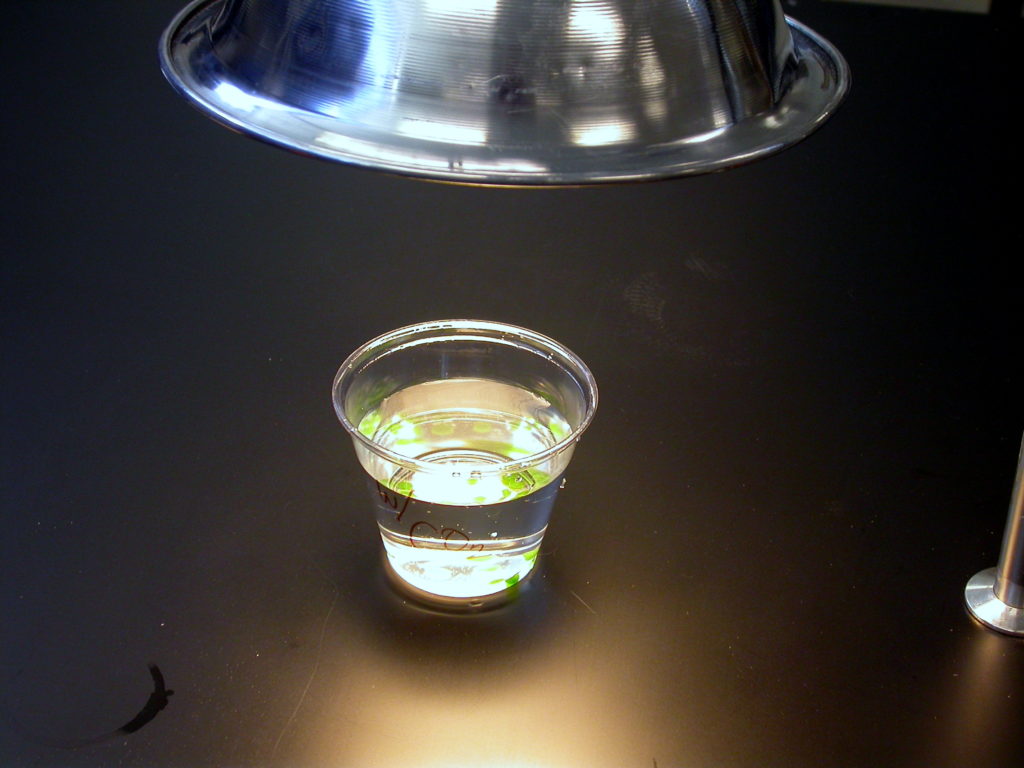
- Pour the disks and solution into a clear plastic cup. Add bicarbonate solution to a depth of about 3 centimeters. (Of course, if you are testing a control with no bicarb fill the cup with plain water.) Use the same depth for each trial. Shallower depths work just as well.
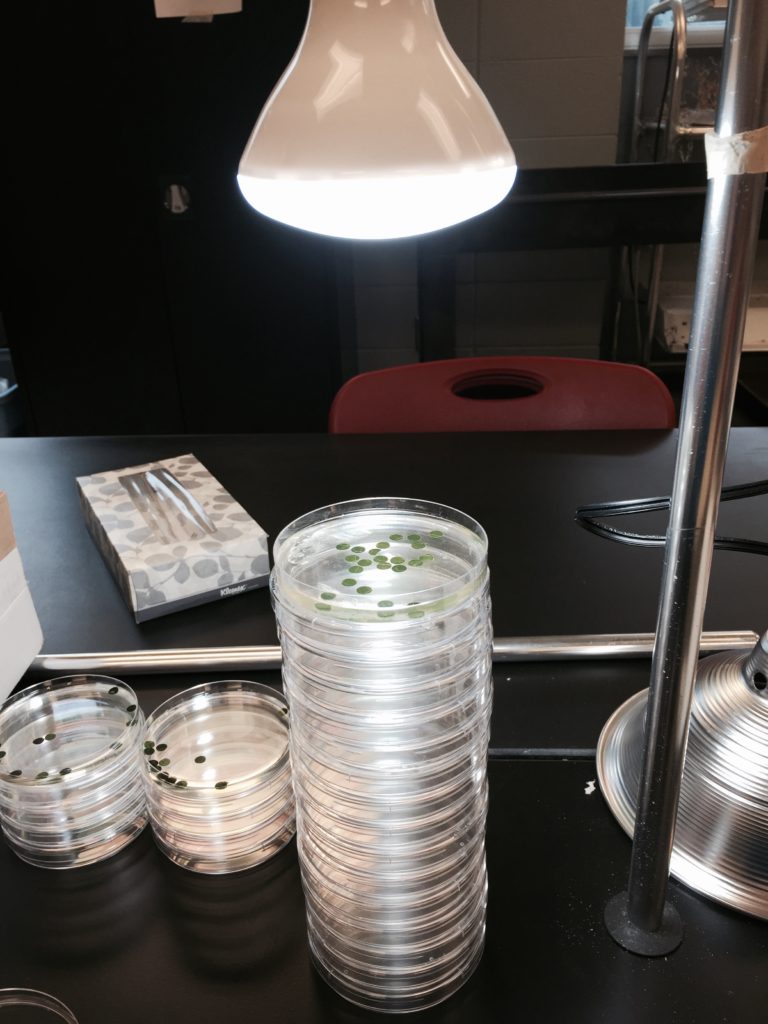
Of course, you don’t have to use plastic cups. In this image, instead of plastic cups, I’m using plastic Petri dishes which I like quite a bit. The petri dish is on a stack of dishes that allowed me to vary the light intensity by varying the distance to the light source. Note, I also have more than ten leaf disks so my sample size is larger. Another modification is that I’m using an LED 65w equivalent daylight. I’ve been using these bulbs almost exclusively, recently. These bulbs are particularly nice since they generate very little heat and they made of plastic and not glass. Another modification to consider is that you actually don’t have to take the disks out of the syringes. Instead you can simply put the syringe under the light source. The disks will rise just the same. This is the method suggested in the Fast Plant reference below.
- For a control, infiltrate leaf disks with a solution of only water with a drop of soap–no bicarbonate and place in a water-only solution in a separate cup. Don’t use the same syringe for your control that you used for the bicarb solution. Why not?
- Place under the light source and start the timer. At the end of each minute, record the number of floating disks. Then swirl the disks to dislodge any that are stuck against the sides of the cups. Continue until all of the disks are floating.
- It is important to keep track of just where under the light you place your sample solutions. A difference of only 1 inch one direction or another from the light source can make a big light difference to the plant.
Suggestions for Data Collection and Analysis
When I first started doing this procedure in my classroom, stopwatches were not readily available. Steuceck and Hill (1985) suggested counting disks at the end of minute intervals and then using the median value as a measure of photosynthesis. This method allowed for fairly consistent but sometimes less precise measurement of the rates of photosynthesis. Here’s how this type of data analysis might be used. These data are from an investigation using grape ivy leaf disks. Later I’ll describe data collection and analysis that takes advantage of modern smartphone technologies.
| Minutes | Disks |
| 1 | 0 |
| 2 | 0 |
| 3 | 0 |
| 4 | 0 |
| 5 | 0 |
| 6 | 0 |
| 7 | 1 |
| 8 | 1 |
| 9 | 1 |
| 10 | 1 |
| 11 | 4 |
| 12 | 7 |
| 13 | 8 |
| 14 | 10 |
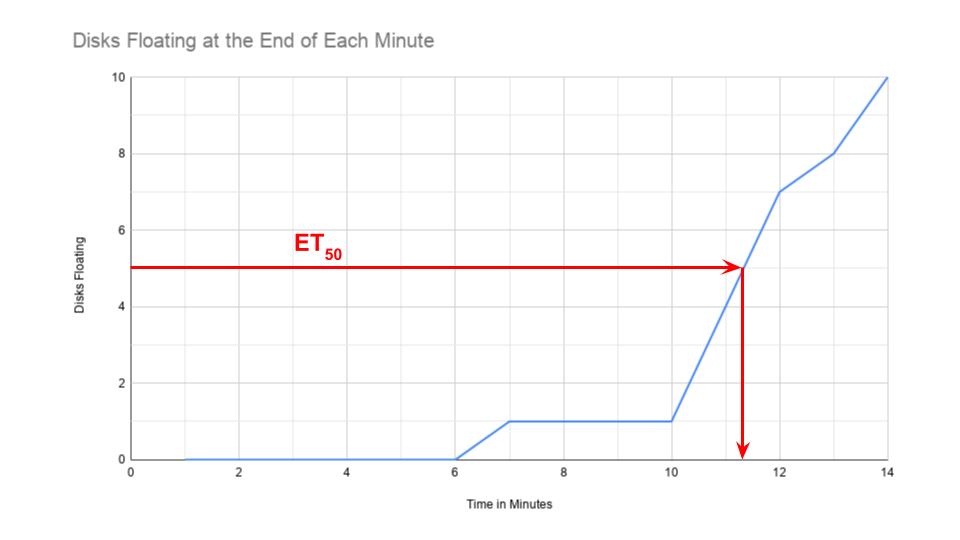
The point at which 50% of the leaf disks are floating (the median) is the point of reference for this procedure. By extrapolating from the graph, the point where 50% of the disks are floating is at about 11.3 minutes. Using the 50% point provides a greater degree of reliability and repeatability for this procedure. Steucek, et. al. (1985) described this term is referred to as
the ET50, which is a measurement of how much time it took for the disks to float. How much time is a quantity–not an actual rate.
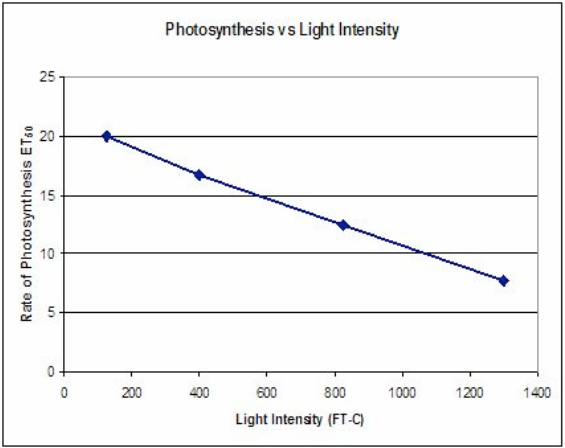
The problem with ET50 is that it goes down as the rate of photosynthesis goes up–it is an inverse relationship and creates the following type of graph (data from Steucek, et. al. 1985):
What is incorrect about the following graph?
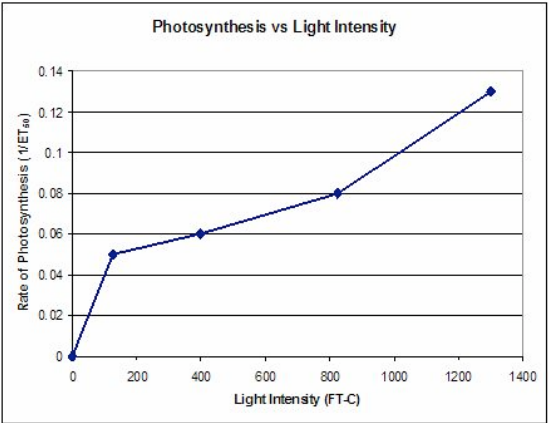
To correct this representation of the data and present a graph that shows increasing rates of photosynthesis with a positive slope the ET50 term can be modified by taking the inverse or 1/ET50. As Paul Anderson has suggested, you could call this a Floats per ET50. The important thing is that this is a rate whereas seconds to float is a measured quantity. Taking the reciprocal creates a graph like this (data from Steucek, et al. 1985.):
Modification: Collecting Data with Smartphone Lap Timers (or, you could just video it)
Almost everyone with a phone has a stopwatch app that has the ability to record lap times which opens up the possibility of timing how long each disk takes to rise. Start the stopwatch when you place the leaf disks under the light and then hit the lap button instead of the stop button as each disk rises to the top. Doing so will generate data like this. (BTW, you could also video the entire process and then use the video to determine the time that each disk rose but that takes longer.) Using the lap timer generates data that looks like this. You should have a lap time for each disk.
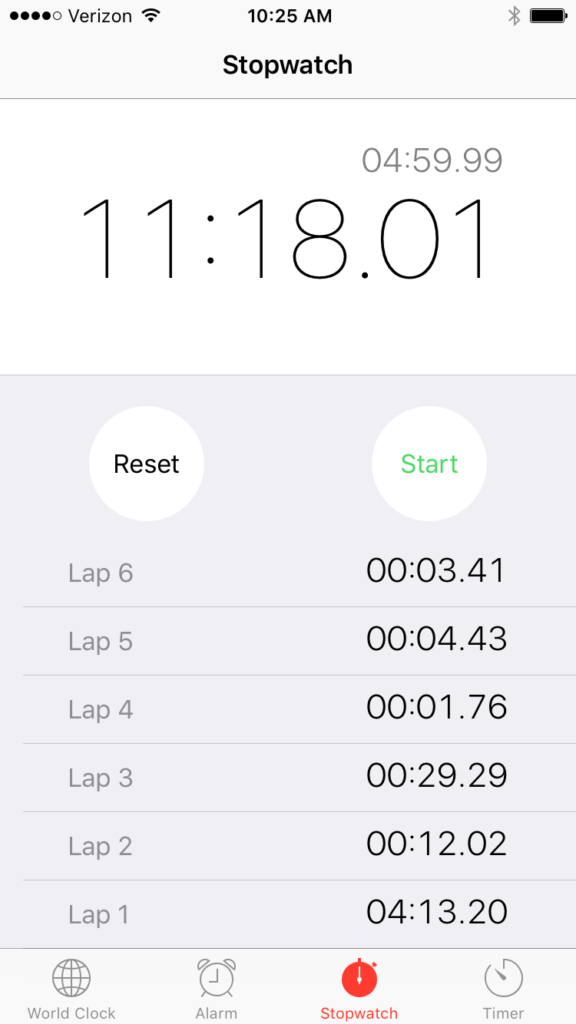
Now, translating this screen into data can be a bit confusing. Lap 1 is how long the first disk took to rise: 4 minutes and 13.2 seconds or a total of 253.2 seconds. The second disk did not rise until 12.02 seconds later so you need to add 12.02 seconds to the time for the first disk which means that the second disk rose at 265.22 seconds from the start. You then need to add the 29.29 seconds to 265.22 seconds to get the 3rd disk and so on.
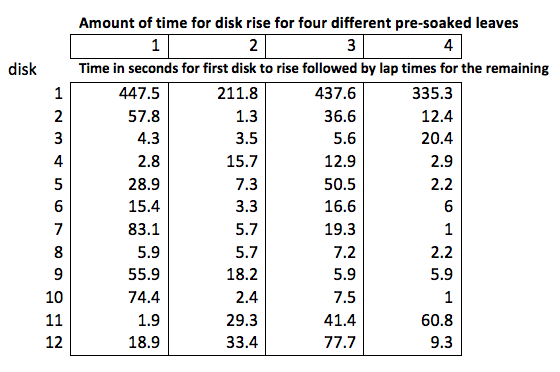
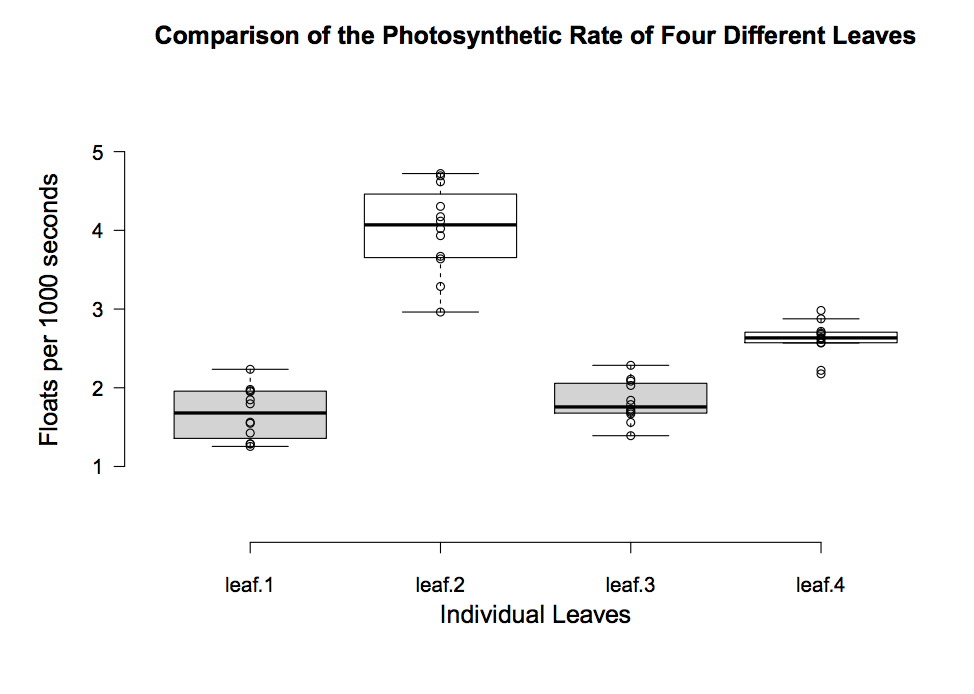
Here are some sample data that compares how consistent this procedure is for 4 separate leaves from the same species (may have been different individuals). This is how the data came from the phone and hasn’t been corrected yet for total time to float.
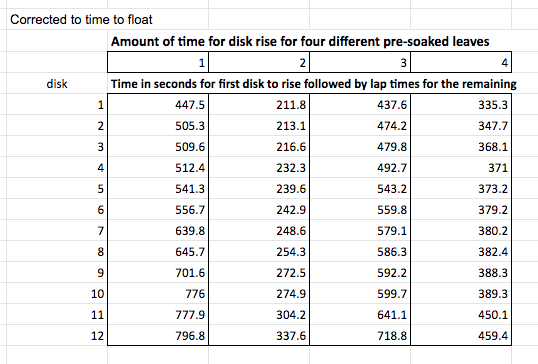
Here’s the same data now, processed to reflect how long it takes each disk to rise.
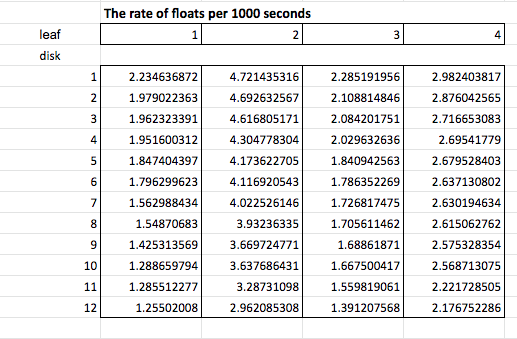
The data is still not converted to rates which, just like before, we do by taking the reciprocal. Since this creates small decimal numbers I’m going to multiply by 1000 seconds to get a rate of floats/1000 seconds. These rates will be a bit easier to read. Now this entire process is known as data manipulation and it’s not about making up something new, it is about making the message in the data more apparent–more clear. Here’s the new data chart.
With this type of data you can now add new analysis: descriptive statistics like mean float rate, standard deviation, standard error, 95% confidence intervals and create informative graphs such as this one.
Extension:
What happens if you place the floating leaf disks back in the dark? Without light, we can assume that photosynthesis is not going to take place but will the leaf disks still do respiration? Will they use the oxygen in the leaf spaces and if they do will the leaves sink? In this graph, the light was turned off at 14 minutes and the cups with their floating disks (grape ivy) were placed in the dark.
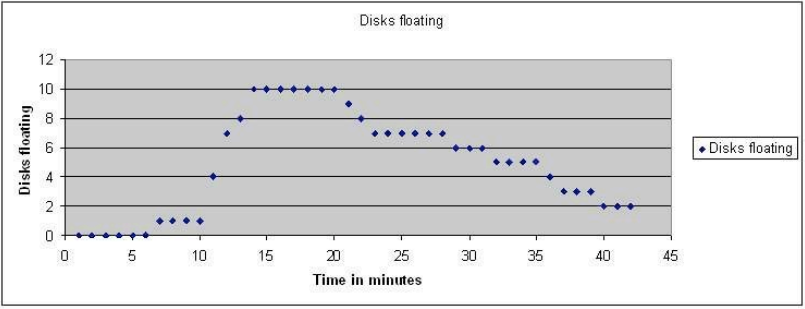
Every minute, I removed the dark cover and counted how many were still floating. Then I stirred the disks. Note that after a while the disks begin to sink. Why? Cellular respiration removes the oxygen from the cell spaces. The rate that the disks sink is an indirect measure of the rate of cellular respiration. Can you think of a way to how you might measure the gross rate of photosynthesis with this technique?
Wrap-up
Hopefully, this procedure that is not a procedure is enough information to help you develop your own protocol to answer your own questions with this lab. I’ll cover more about the lab in other posts but my purpose here was to simply provide enough guidance to get you started down your own path to discovery.
Print and Web Resources:
Wickliff, J.L. and Chasson, R.M. 1964. Measurement of photosynthesis in plant tissues using bicarbonate solutions. Bioscience, 14: 32-33.
Steucek, Guy L. Robert J. Hill and Class/Summer 1982. 1985. Photosynthesis I: An Assay Utilizing Leaf Disks. The American Biology Teacher, 47(2):96-99.
Tatina, Robert E. 1986. Improvements to the Steucek and Hill Assay of Photosynthesis. The American Biology Teacher, 48(6): 364-366.
Juliao, Fernando and Henry C. Butcher IV. 1989. Further Improvements to the Steucek and Hill Assay of Photosynthesis. The American Biology Teacher, 51(3): 174-176.
Rukes, Kari L. and Timothy J.Mulkey. 1994. Measurement on the Effects of Light Quality and Other Factors on the Rate of Photosynthesis. Bioscene, 20(3): 7-11. http://www.acube.org/volume_20/v20-3p7-11.pdf
Greenler, John. 1990. Exploring Photosynthesis with Fast Plants. Wisconsin Fast Plant Notes, 4(1): 4-5. http://www.fastplants.org/pdf/activities/exploring_photosynthesis.pdf
Anderson, Paul. 2011. Photosynthesis Lab Walkthrough. video: https://www.youtube.com/watch?v=ZnY9_wMZZWI